Key Features

map16 Key Features

By Key Features

map16 Key Features are designed to simplify everyday process

Every key feature has been crafted to increase efficiencies by increasing the simplicity of our client workflows. Our key features apply to all our solutions. These included;


Mobile Collection

Our innovative new way of collecting data, allows a one time setup that enables constant working, without the need for creating separate work packages. Set custom map visualisations such as parked car revisits to enable teams to get key information live in the field. Powered by the world leader in GIS technology, Esri.

Explore

key Features Mobile Collection


Inspection Dashboards

View key operational reports. Live KPI updates, crew productivity reports, showing day by day totals. Access all defect reports via a one click download button. Or even an automated daily email.

Explore

map16 - Inspection Dashboard


Asset Dashboards

Here at map16, we provide a simplified and easy to use asset management system, where clients can visualise and export asset attribute data with a click of a button. Automatic asset inventory creation, keeps track of new and existing assets on the network.

Explore

asset-dashboard


Map Views

With unlimited user access to all our web dashboards, our clients can gain access to live inspections data and historic records. Generate detailed reports to answer queries across your highway network.

Explore

mapview


Browse All Key Features

Each of our key features are tailored to meet the requirements of every solution, not just an off the shelf product. Everything is designed to integrate into your current asset management requirements.

All Key Features


Gully Management System

Get More Out Of Your Gully Management System

By Gully Maintenance, Map16, Mobile Collection, Solutions, Web Dashboard

Here at map16 we wanted a gully management system that would give our clients more than ever before. Not just access to live data, but a system where that data has been visualised and made easily accessible for the every day user. All the day to day analysis and tabulation has already been done for you, just export it.

A gully management system that saves time throughout the day and never becomes an onerous chore to use.

The key features of our gully management system are outline below;

Mobile Collection

Our innovative new way of collecting data, allows a one time setup, enabling constant working, without the need for creating separate work packages. Set custom map visualisations, such as parked car revisits to enable teams to get key information live in the field. Powered by the world leader in GIS technology, Esri.

 map16 provides a mobile solution designed to increase efficiency and reduce cost. Collect new assets and live inspections. Use iOS or Android.
map16-mobile-collection
    • End Of Back Room Processing
    • End Of Work Packages
    • One Time Setup
    • Work Offline
    • Automated Revisit Maps
  • OS Mastermap As Standard


Inspection Dashboards

Designed to give operational staff access to live reports, that have been created to reduce wasted time and increase efficiency. Change the way you work, let map16 dashboards do the work for you.

View key operational reports. Live KPI updates, crew productivity reports, showing day by day totals. Access all defect reports via a one click download buttons. Or even an automated daily email.
 An inspection dashboard we always wanted
    • KPI Reporting
    • Crew Productivity Reports
    • Defect & Silt Level Reporting
    • Road By Road Reporting

Find Out More

map16 - Inspection Dashboard


Asset Dashboard

View and interrogate your asset data like never before, access any data within 2 clicks. Here at map16, we provide a simplified and easy to use asset management system, where clients can visualise and export asset attribute data with a click of a button. Automatic asset inventory creation, keeps track of new and existing assets on the network.
Use a system that will manage and visualise your asset data for you
    • Visual Overview Of Asset Figures
    • Detailed Asset Reporting
    • Parish By Parish Reporting (Or Any Other Geospatial Boundary)
    • Live Inventory Creation

Find Out More

map16 - Asset Dashboard


Map Views

A mapping interface that gives you access to live inspection data, historic data and detailed reporting tools. Designed for all assets and work streams. Increase user interaction with unlimited user access and the simplicity of the workflow. Generate detailed reports to answer queries across your highway network.

A mapping interface design for users by users
    • Live mapping interface
    • Query & Filter Live Data
    • View Live & Historic Inspections
    • Create Detailed Reports
    • Street View Integration
  • Answer Public Queries In Seconds

Find Out More

map16 - map view


Risk Level Dashboards

As a standard map16 provides a risk analysis of your highway assets. Increase efficiency by adopting a risk based approach. Use map16 risk dashboards to visualise risk levels anywhere on your highway network

In a risk based maintenance regime geospatial information can be used to create a targeted and more cost-effective approach. From analysis of simple historic data to flood zoning, population density, slope data, tree fall and insurance claims we create a detailed risk model of your asset datasets. Feed live inspection data into the risk model to give constant risk analysis of the network.
Make operational decisions based on risk
  • Visual Overview Of Risk Data
  • Easy Export Of Key Data
  • Live Road By Road Risk Updates
  • Risk Level MapView

Find Out Moremap16 - Risk Level Dashboard

To find out more about our drainage solutions, click on the link below.

Our Drainage Solutions

100% electronic drainage data

100% Electronic Drainage data

By Map16, Mobile Collection, Planned And Reactive, Solutions, Web Dashboard

When it comes to highway drainage contracts there is always a number of key workstreams involved;

  1. Routine Cleansing Of Highway Assets
  2. Planned Jetting And CCTV Works
  3. Emergency Response

The routine cleansing is normally electronically mapped as standard, showing key inspection information including silt levels and conditional information of highway assets.

However planned jetting, cctv works and emergency responses are often neglected when it comes to GIS data capture. These could be collected via paperwork and archived forever.

When 100% of drainage data is mapped and analysed, it can provided vital information about the condition of the highway network. 

Here at map16 we provided a complete solution to map and collect 100% of all drainage works carried out on any highways network.  All our systems come with the ability to map planned jetting works and emergency call outs at no extra cost. Custom dashboards are designed to give our clients a clear view of exactly what works being carried out. Each system is tailored to our clients every needs.


map16 – Jetting/CCTV works dashboard

map16 – Reactive works dashboard


Never before has it been so easy to map the hidden data. Every iPad has the ability to collect the standard asset cleansing data, as well as jetting and emergency responses.

Hotspot analysis can show where there is an increase in floods, blocked drainage or CCTV works. All data is linked to live data from map16 mobile pads.

map16 – Hotspot analysis of drainage works

Once all drainage works are collected using the map16 system, it can be used to create detailed hotspot analysis of works being carried out. Analysis of this data gives a clear indication where clients are spending increased time and resources.


map16 – Visualisation of drainage works by type


When in comes to jetting and cctv works, teams on the ground can log the position of their job, then map all the highways assets they have been working on. This could include, gullys, catchpits, soakaways, linear drainage, beany blocks and any other assets required.

Create a clear picture of assets being maintained outside of the routine cleansing. 

Asset mapping for all drainage works


When it comes to emergency response’s, map16 can provide an easy way to create a clear picture across your highway network. Map any emergency response, from flooding, blocked gully’s, oil spills, blood clean ups and any others required. Our system will show clusters and hotspots of all emergency works.


map16 – Emergency response clusters

Get in touch and see what we can offer

0800 772 396


map16 - 2018 - eBrochure

map16 – eBrochure – 2018

By Map16, Mobile Collection, Solutions, Web Dashboard

Find out what map16 can offer your business. Everything in the brochure comes standard to all our clients, giving organisations the ability to pick and choose a design to meet their needs.

Our solutions are designed for every highway asset, including, drainage gullies, grit bins, trees, safety barriers and much more.

View our new eBrochure below

map16-Asset-Management-Ltd-2018-Brochure


Download Or Print Brochure Here

Or

Get in touch and see what we can offer

0800 772 396

unlimited user access to web dashboard

Unlimited User Access To Our Web System

By Map16, Web Dashboard

Why have a system that shows key data and reportable information, and be restricted by user access.

Here at map16 we believe in empowering more people to see the benefit of geographic data, through systems that do not need a huge amount of experience or training to operate. All our systems have been built with the end user in the forefront of our mind.

Giving more people access to live data and easy to use reports, will increase efficiencies across any business. Thats why as standard, map16 provides unlimited user access to our web system to all our clients. It is in their hands how many, or how little users have access to their system. We have found if more people have access to data, there is less emails, phone calls and inevitably less queries.

map16 - Web Dashboard

Why not use a system that answers your questions for you

No matter if your organisation has 2 users or 2000 users, we provide this level of accessibility free of charge. There is no extra cost for adding additional users as time goes on. We are flexible to everyones needs.

Get in touch and see what we can offer

0800 772 396

Gully Maintenance And Flood Risk

Gully Optimisation And Flood Risk Analysis As Standard

By Gully Maintenance, Map16, Solutions, Web Dashboard

In a risk based maintenance regime, geospatial information can be used to create a targeted and more cost-effective approach to gully cleansing.

map16 provides as standard, live flood risk analysis and optimisations. Based on key flood risk layers available including surface water flood zones, known flooding areas, anonymised insurance claims, Lidar elevation models, historic silt levels and any other dataset available. Our system allows clients to make accurate decisions on cleansing optimisations year in, year out. Compare against current cyclical frequencies to produce proposals for future cleansing. The aim is to give our clients the tools to design the most cost-effective and targeted cyclical regimes.

map16 provides the tools for clients to drive efficiencies by taking an innovative approach.

From our industry experience the process of optimising cleansing regimes has always been at the forefront of our clients mind, data lead programmes with evidence to back proposals is key. When developing our system we wanted to provide this as a standard to all of our clients. Once again, our ethos was to design a system,  accessible to everyone. As a standard and at no extra cost we provide a number of key tools.

1 – Baseline risk analysis

As a starting point, we carry out a risk analysis of current asset data, using all datasets available. This will provide a view of the current state of the network. Once this has been completed, it will be updated by the live data collected by crews on the ground.

2 – Risk Analysis Dashboard

Risk data needs to be easily accessible to everyone using our system. Our dashboards provide visual indicators of risk levels across the network. Easily export high risk assets with a touch of a button.


map16 - Flood Risk Analysis - Dashboard

3 – Risk Analysis Map View

Although the dashboards show the data in a clear and concise way, there is nothing better than actually seeing it from a mapping perspective. Search any location across your network, to see exactly what risk levels are associated and what cleansing regimes have been assigned.

map16 - Flood risk mapping


4 – Live Risk Level Updates

Once data is being collected using the map16 tablets on the ground, this information is automatically fed through risk models. Get live updates of asset by asset, road by road risk levels. It is inevitable that the condition of the network is ever changing. Why work with data that could be years out of date. map16 provides latest risk analysis with integration of live data.

 Get In Touch An See How We Can Help Optimise Your Cleansing Regimes

0800 772 396

Automated parked car revisits

Automation Of Parked Car Revisits

By Gully Maintenance, Mobile Collection, Solutions, Web Dashboard

One of the major challenges facing gully maintenance across the UK highways is parked cars.

Contractual requirements usually state multiple visits against every parked car. map16’s system was designed with these problems in mind, and provides the ability to automate this process. When teams on the ground come across gullies with parked cars, these are logged as usual. However, instead of this data being hidden within inspection data, they are automatically sent to a bespoke map on every crews iPad.

There is no interaction from crews on the ground, or any operational staff. Automation is the key to increase efficiency and reduce cost

A standard visualisation is based on the traffic light system. RED indicates 1 visit, ORANGE 2 visits and GREEN 3 visits, or has been cleaned. This clear workflow gives crews on the ground clear direction of where to target their revisits, with no confusion of what has, or hasn’t been cleaned.

iPad View – Teams on the ground can see exactly what revisits have been completed. Green – Completed – Orange – 2 Visits – Red – 1 Visit

This automation is not just limited to mobile collection, we have also integrated this concept into the web dashboards. It is a necessity for operational staff need to quantify numbers of parked car revisits, yet, this is often an arduous task.  To make this process as simple as possible, we have provide one button exports of parked car revisit data. Export data at every step, and follow your crews progress live from the field.

Each button will export exactly how many parked cars have been visited once, twice and three times.

These datasets will not only show time and date, but are enriched with network data such as USRN, road name, borough and parish. Let map16 take away the frustrating aspects of running gully maintenance projects across county wide areas.


Find out more by getting in touch – 0800 772 396

end-of-work-packages

End Of Work Packages For Highway Mapping

By Gully Maintenance, Mobile Collection, Solutions

Are you tired of creating work packages?  

While working in the highway mapping industry, we always spent time creating work packages, whether it was in the office or with teams in the field. Therefore we designed a more efficient solution….

map16’s solution removes the need for work packages for every aspect of highway mapping. All our devices a pre configured specifically to meet contractual needs. Every device has the ability to view all assets and mapping live, whether it’s 1,000 to 1,000,000. This enables clients to effortlessly collect new assets or inspections without issues. Gone are the days when the size of datasets brought collection to its knees. Live updates are passed between all devices, so duplicate inspections will not occur.

Just grab a tablet device and start collecting. 1 – Live Map, 1 – County Wide Offline Map.


On larger county wide networks, there will be a loss of 3G/4G signal, therefore offline working is a necessity. Along with the live mapping on the devices, there are predefined downloaded maps to ensure the work can continue, even in the most remote areas. Once devices are back in signal, data is transferred back to the system. Our offline maps also have the ability to update themselves when required. A click of a button updates offline data with the most up to date inspections.

Teams will get the latest datasets even when working offline.

Try a new way of working today, get in touch and see how these solutions can benefit your business workflows

Get In Touch – 0800 772 396

map16 Gully Cleansing and Gully Maintenance

Gully Mapping And Inspections Made Easy

By Gully Maintenance, Map16, Mobile Collection, Solutions, Web Dashboard

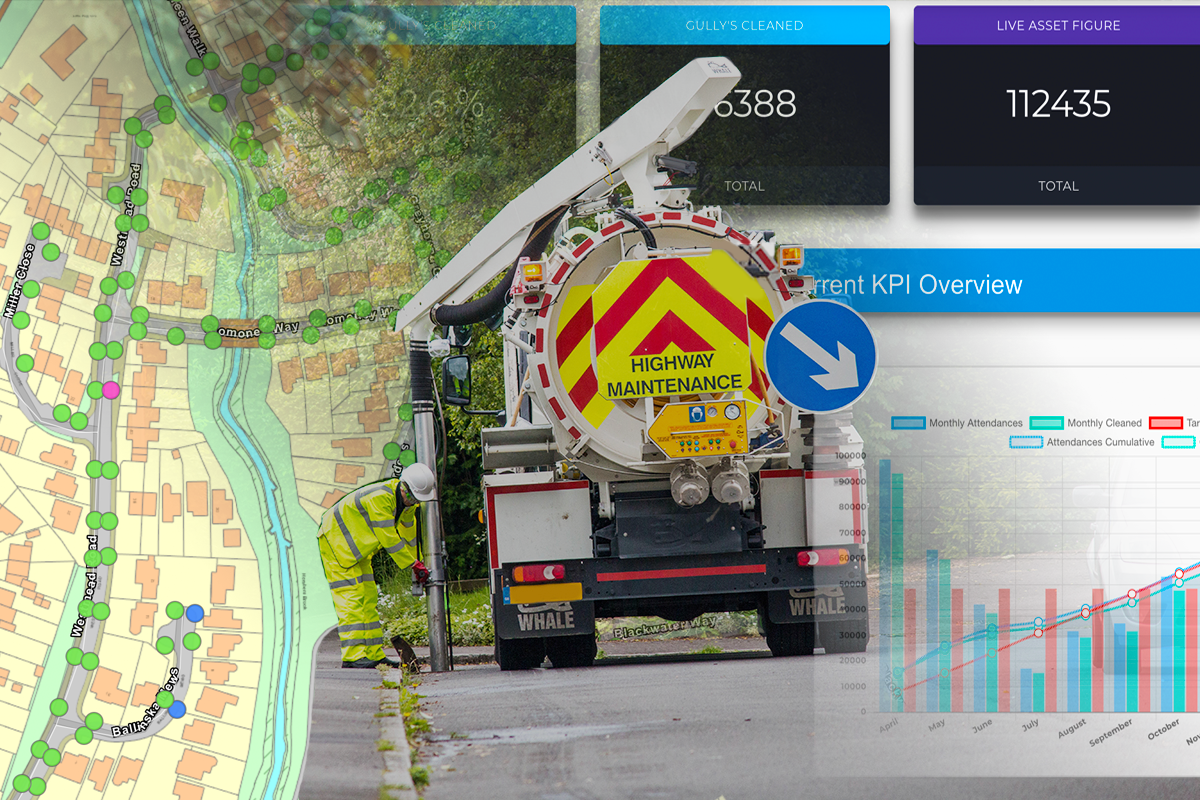
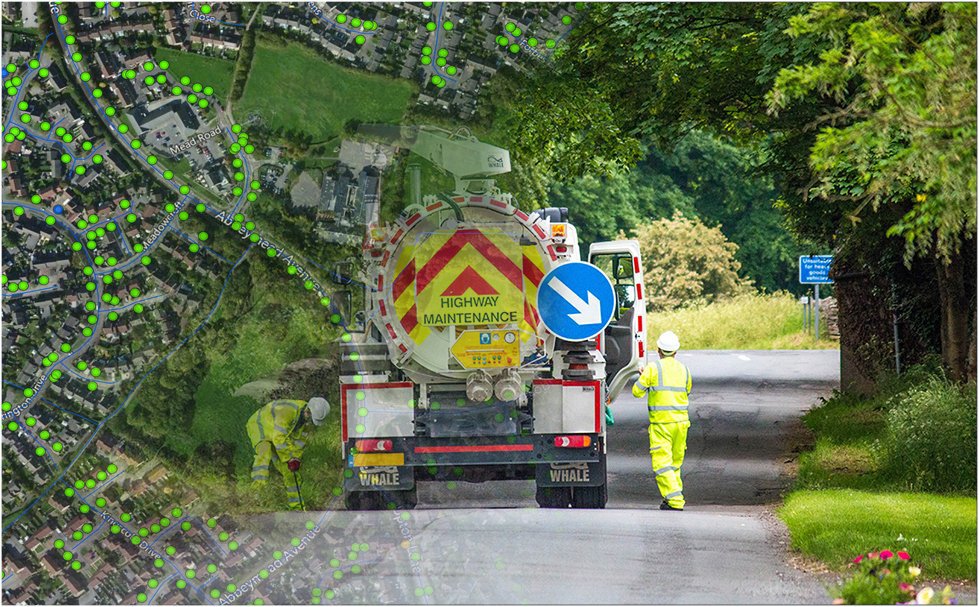
Map16 are changing the way gully inspection and mapping is being carried out across the UK highways. Years of development went into fine-tuning the solution, which is now available in the market place.

The map16 system is now managing over 221,100 assets and over 966,000 inspection records daily, all of this with no interaction from operational staff at any time throughout the year.

Our innovative solutions set us apart from the competition and give our clients a cost effective approach to collecting county wide inspection data on any drainage assets.

What do we do differently? Keep reading to find out.

One Time Setup

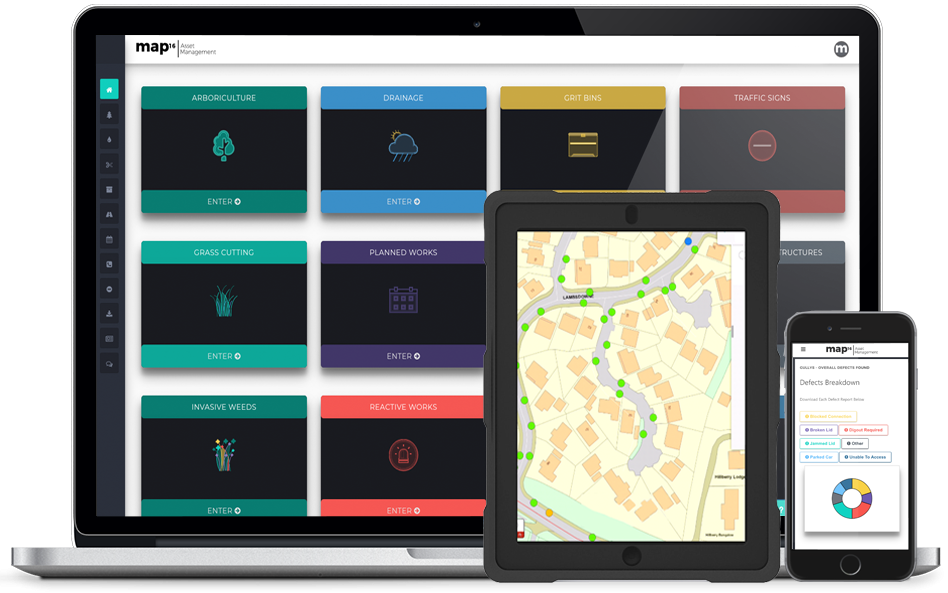
map16 does the hard work for you, year in and year out. At the start of every contract map16 provides everything, fully setup iPads and integrated web dashboards, specifically designed to fit our clients need. Yearly KPI’s are integrated, and all historic data is transferred from any other sources.

OS MasterMap As Standard

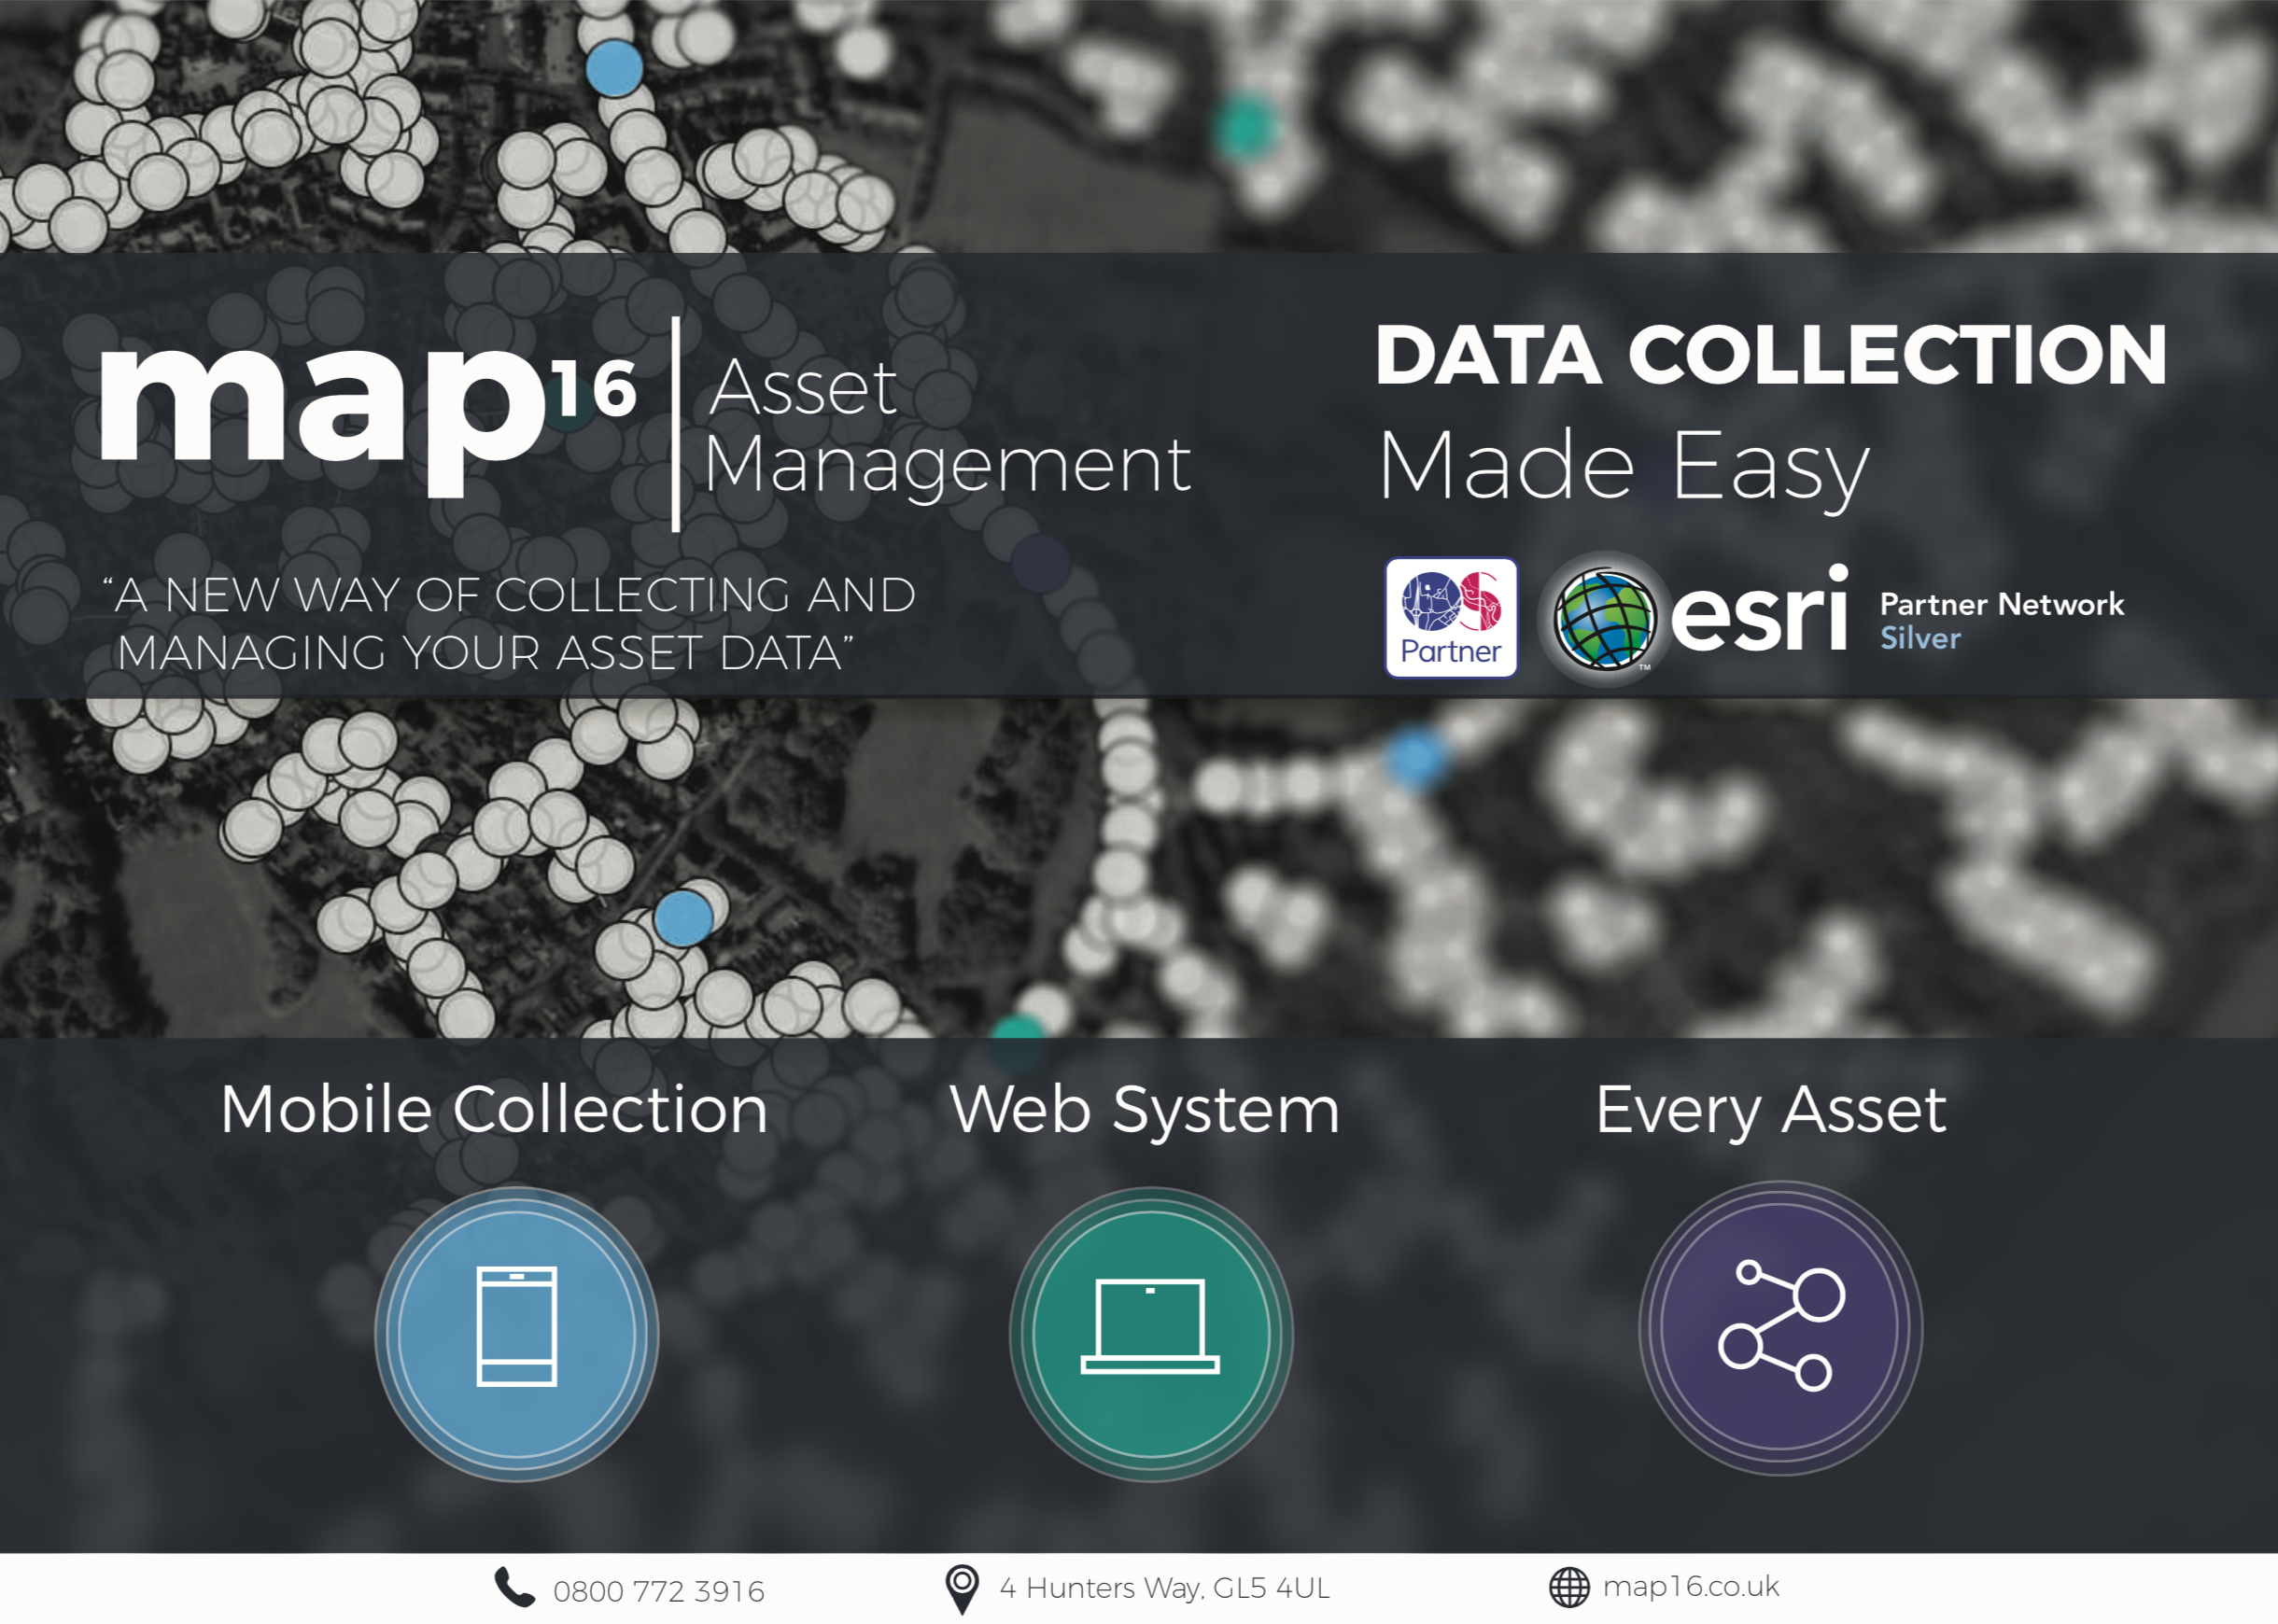
To provide an industry standard of asset mapping and management, it is a necessity to capture accurate data. By becoming an Ordnance Survey Partner, map16 provides the highest detailed mapping as a standard. This is used in both our mobile collection devices and our web dashboard. Stay tuned on further news updates on map16 as OS Partner. Linkedin

Find Out More

map16 ordnance survey partner


No More Work Packages.

end-of-work-packages

Crews and operational teams no longer have to download new areas to work from. They can work live on map16 tablets, with all asset data instantly available. When in areas of no signal, they are able to move seamlessly to an offline map, covering county wide areas. Data is then transferred when signal is regained. As part of the initial setup, tablets come preloaded with offline maps. This simple change in workflow increases operational efficiency every step of the way.

Find Out More

Custom Views

All views are dictated by our clients. Anything from borough by borough to visualised by cleansing frequency. This ensures teams on the ground only see gullies they have to clean. Along with this, every iPad is linked so inspections from other crews are visible to everyone. No one wants inspections to be done twice, when not needed.

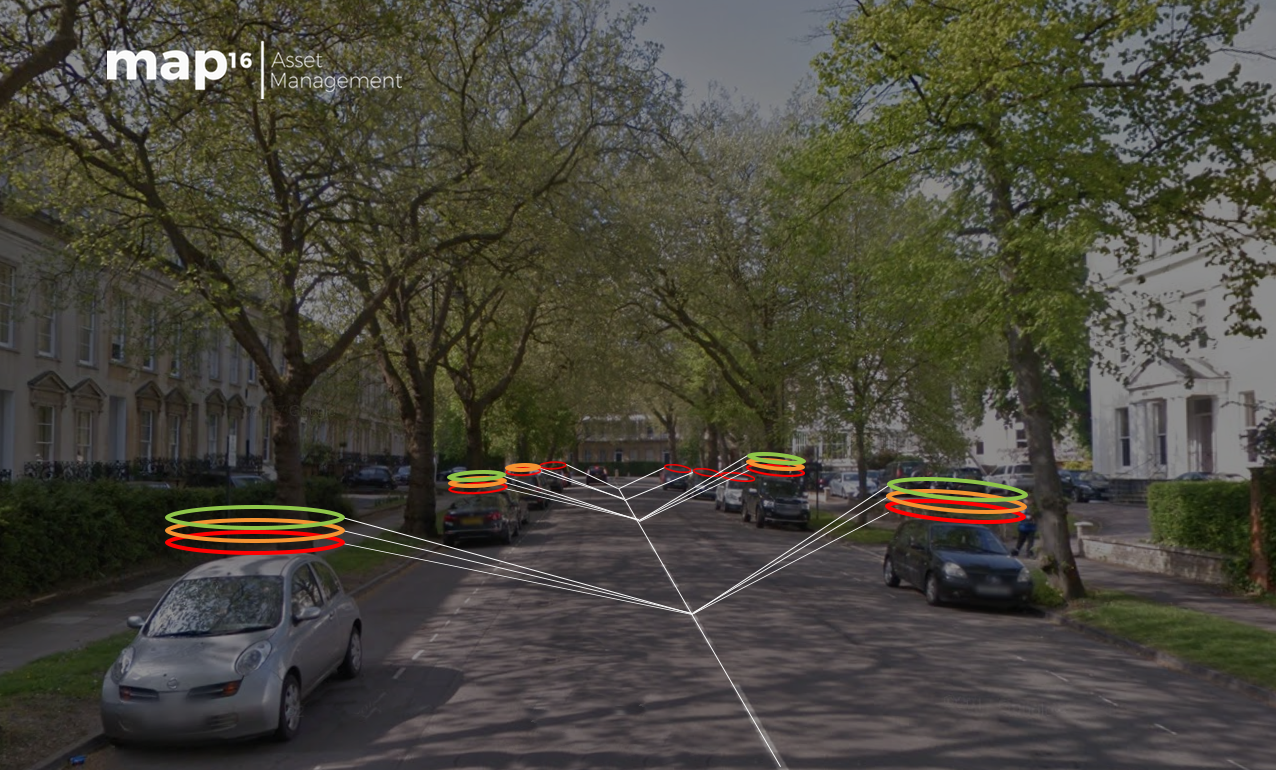
Automated Parked Car Revisit Maps

Automated parked car revisits


map16 provides custom revisit maps that are automatically populated by live data collected in the field. We operate a traffic light system, depending on revisits required. As an example, parked cars have to be visited 3 times. When they are located, it will appear on the map as RED, when a second inspection is done it will turn ORANGE, once the final inspection is complete, it will turn GREEN. If it gets cleaned on the second visit it will also turn green. This enables teams on the ground to see exactly what needs to be done. The web dashboard also enables operational staff to export all outstanding park car inspections with a click of a button.

Find Out More

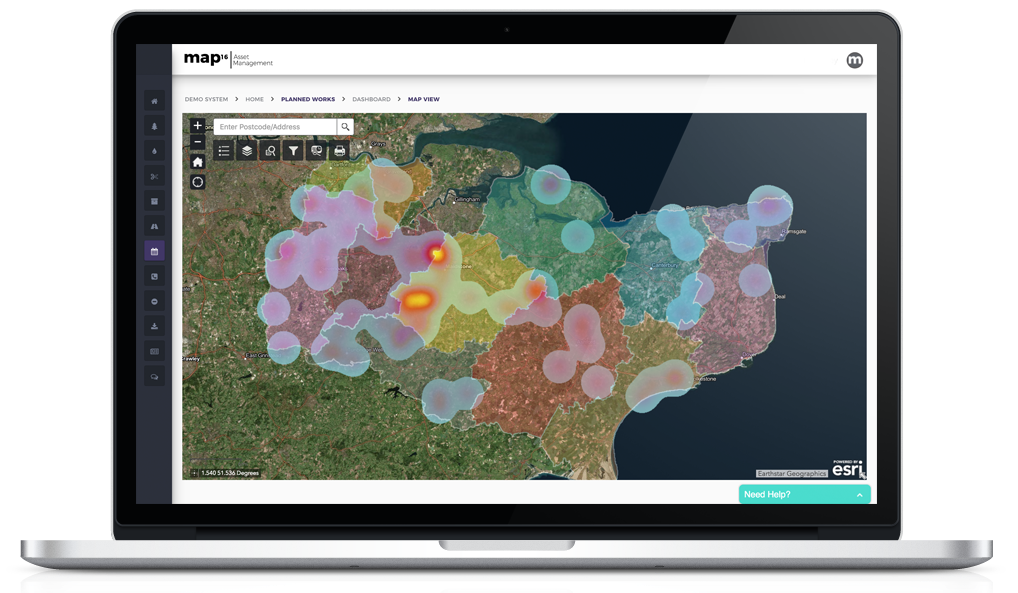
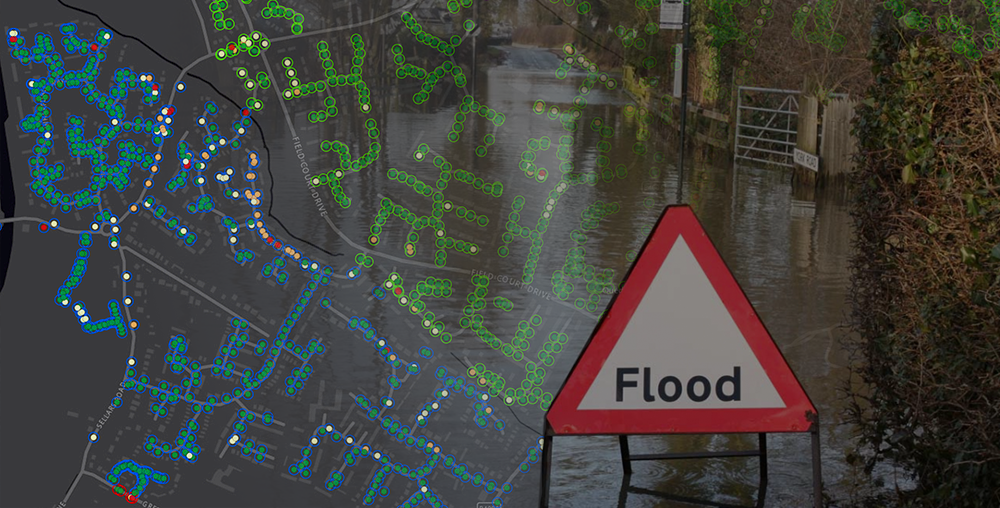
Flood Risk Analysis Provided As Standard

map16 flood risk analysis

Integrated into every map16 gully system is live flood risk analysis. Which is based on key flood risk layers available. These include surface water flooding zones, known flooding areas, anonymised insurance claims, Lidar elevation models, historic silt levels and any other dataset available. Our system allows our clients to make accurate decisions on cleansing optimisations throughout the year.
Drive efficiencies by taking an innovative approach. Follow map16 on Linkedin to find out more in the next few weeks.

Find Out More

Interactive Programme Of Works

map16 - Interactive programme of works

When it comes to routine gully maintenance, clients want to know 3 things.

  1. Have you been there.
  2. When were you there last
  3. When are you going to be there next.

Why not have the answers to all these questions in one system. We provided live inspection data, access to all historic records, and now an interactive forward facing programme. We can take any MS Excel or Project programme and import it into the system. Users can then update progress and download all changes, live directly from the system.

Follow map16 on Linkedin to read a more detailed article coming in the next few weeks.

Unlimited User Access To Our Web Dashboard

map16 - Web Dashboard

It is clear that giving more people access to live data is key. As a standard, map16 provide unlimited user access to everyone that requires it. We have found that if more people have access to the data, emails, phone calls and queries will decline.
Why ask the question when you can answer it yourself, quicker than ever before.

Find Out More

Follow map16 on Linkedin to see detailed articles on each aspect over the next few weeks

If This Could Benefit Your Business – Get In Touch An Request A Demo

0800 772 396

take a standardised approach

A Standardised Approach To Asset Management

By Map16, Mobile Collection, Solutions, Web Dashboard

Our system provides 4 core aspects to make a standardised solution.

Why not standardise the way your organisation collects and manages all their assets, inspections and separate workstreams.

1 – Mobile Collection

map16 provides a mobile data solution for any business need. Map new features, collect new inspection records for all highway assets. Every aspect is streamlined to increase operational efficiency, and overall reducing the cost. Using innovative new technique to remove the need for work package creation and automation of asset revisit maps. Stay tuned over the next few weeks to read more detailed articles.

map16 - Mobile Solution


By creating a standard user interface, operatives working on drainage or safety barriers, will be familiar, and no extra training will be required.

2 – Inspection Dashboards

No matter what type of inspection data is required, we create a standardised approach to reporting. The focus of our inspection dashboard is to give clients the data they need at their fingertips. Export any data within two clicks.


Standardised inspection dashboards

A well crafted dashboard, should automatically reduce the work carried out behind the scenes in any business.

  • Overview of progress across the highway network
  • Clear KPI reports with exportable data
  • Crew reports showing progress and productivity
  • Defect reports or any other data available.
  • Road by road reports

All reports are designed for all data to be exported in any format required, including CSV, shapefile and geodatabase.

Find out More

3 – Asset Dashboards

In any good asset management system there is the ability to interrogate core asset data. Here at map16, we provide a standardised approach to asset data analysis from traffic signs to highway gullies. Customised to meet the need of every client.

Standardised asset dashboards

All reports are designed to be exported. No need to query datasets, everything has been created for you.


  • Overview of key asset figures (e.g. size, condition and number of species)
  • Breakdown of asset data based on geographic area. (e.g. district, parish, borough and ward)
  • Detailed breakdown of key attributes.(e.g. tree maturity, illumination type and cleanse frequency)
  • Defect reports or any other data available.
  • Road by road reports

Our bespoke dashboards create a standardised view for every asset.

4 – MapView

The final and maybe the most important aspect is the map view. This is the most used part of our system, as it integrates every aspect;

  • Current inspection data – Live from mobile collection devices
  • Historic inspection data – All data ever collected on the network
  • Asset data – No limit on asset numbers or types, point, polygon or polyline.
  • Road networks
  • Areas – Districts – Parish – Borough – Ward


Our standardised map views have the same tools through every system, asset or work stream.

Allows the workforce to seamlessly move between any dataset with no worry of additional training or getting lost in a complex user interface

Get In Touch And Lets Us Show You – 0800 772 396