In a risk based maintenance regime, geospatial information can be used to create a targeted and more cost-effective approach to gully cleansing.
map16 provides as standard, live flood risk analysis and optimisations. Based on key flood risk layers available including surface water flood zones, known flooding areas, anonymised insurance claims, Lidar elevation models, historic silt levels and any other dataset available. Our system allows clients to make accurate decisions on cleansing optimisations year in, year out. Compare against current cyclical frequencies to produce proposals for future cleansing. The aim is to give our clients the tools to design the most cost-effective and targeted cyclical regimes.
map16 provides the tools for clients to drive efficiencies by taking an innovative approach.
From our industry experience the process of optimising cleansing regimes has always been at the forefront of our clients mind, data lead programmes with evidence to back proposals is key. When developing our system we wanted to provide this as a standard to all of our clients. Once again, our ethos was to design a system, accessible to everyone. As a standard and at no extra cost we provide a number of key tools.
1 – Baseline risk analysis
As a starting point, we carry out a risk analysis of current asset data, using all datasets available. This will provide a view of the current state of the network. Once this has been completed, it will be updated by the live data collected by crews on the ground.
2 – Risk Analysis Dashboard
Risk data needs to be easily accessible to everyone using our system. Our dashboards provide visual indicators of risk levels across the network. Easily export high risk assets with a touch of a button.

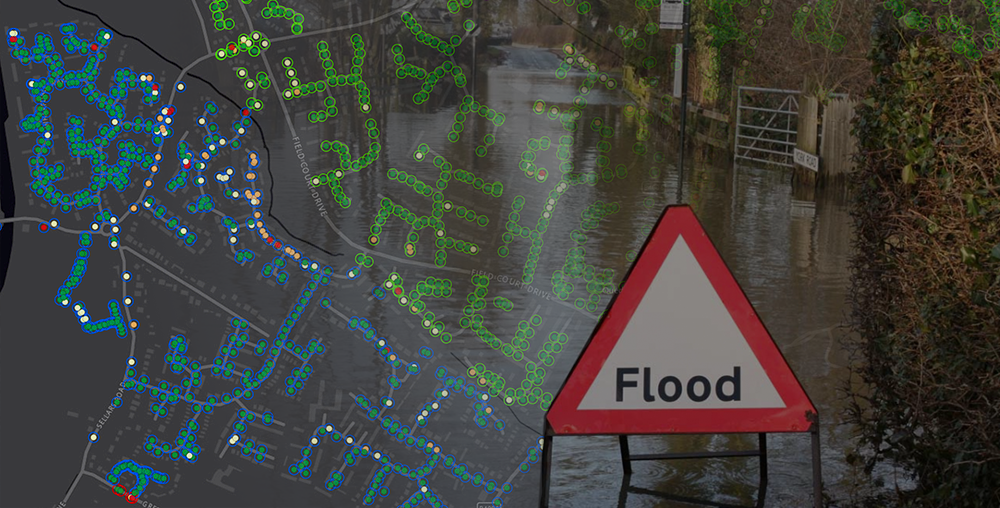
3 – Risk Analysis Map View
Although the dashboards show the data in a clear and concise way, there is nothing better than actually seeing it from a mapping perspective. Search any location across your network, to see exactly what risk levels are associated and what cleansing regimes have been assigned.

4 – Live Risk Level Updates
Once data is being collected using the map16 tablets on the ground, this information is automatically fed through risk models. Get live updates of asset by asset, road by road risk levels. It is inevitable that the condition of the network is ever changing. Why work with data that could be years out of date. map16 provides latest risk analysis with integration of live data.
Get In Touch An See How We Can Help Optimise Your Cleansing Regimes
0800 772 396